Figure 3
Preliminary Report on the Effect of Mesenchymal Stem Cell Therapy in Patients with Chronic Lung Allograft Dysfunction
Cesar A Keller*, Thomas A Gonwa, Athena L Russell, David O Hodge, David B Erasmus and Abba C Zubair
Published: 28 August, 2018 | Volume 2 - Issue 1 | Pages: 035-047
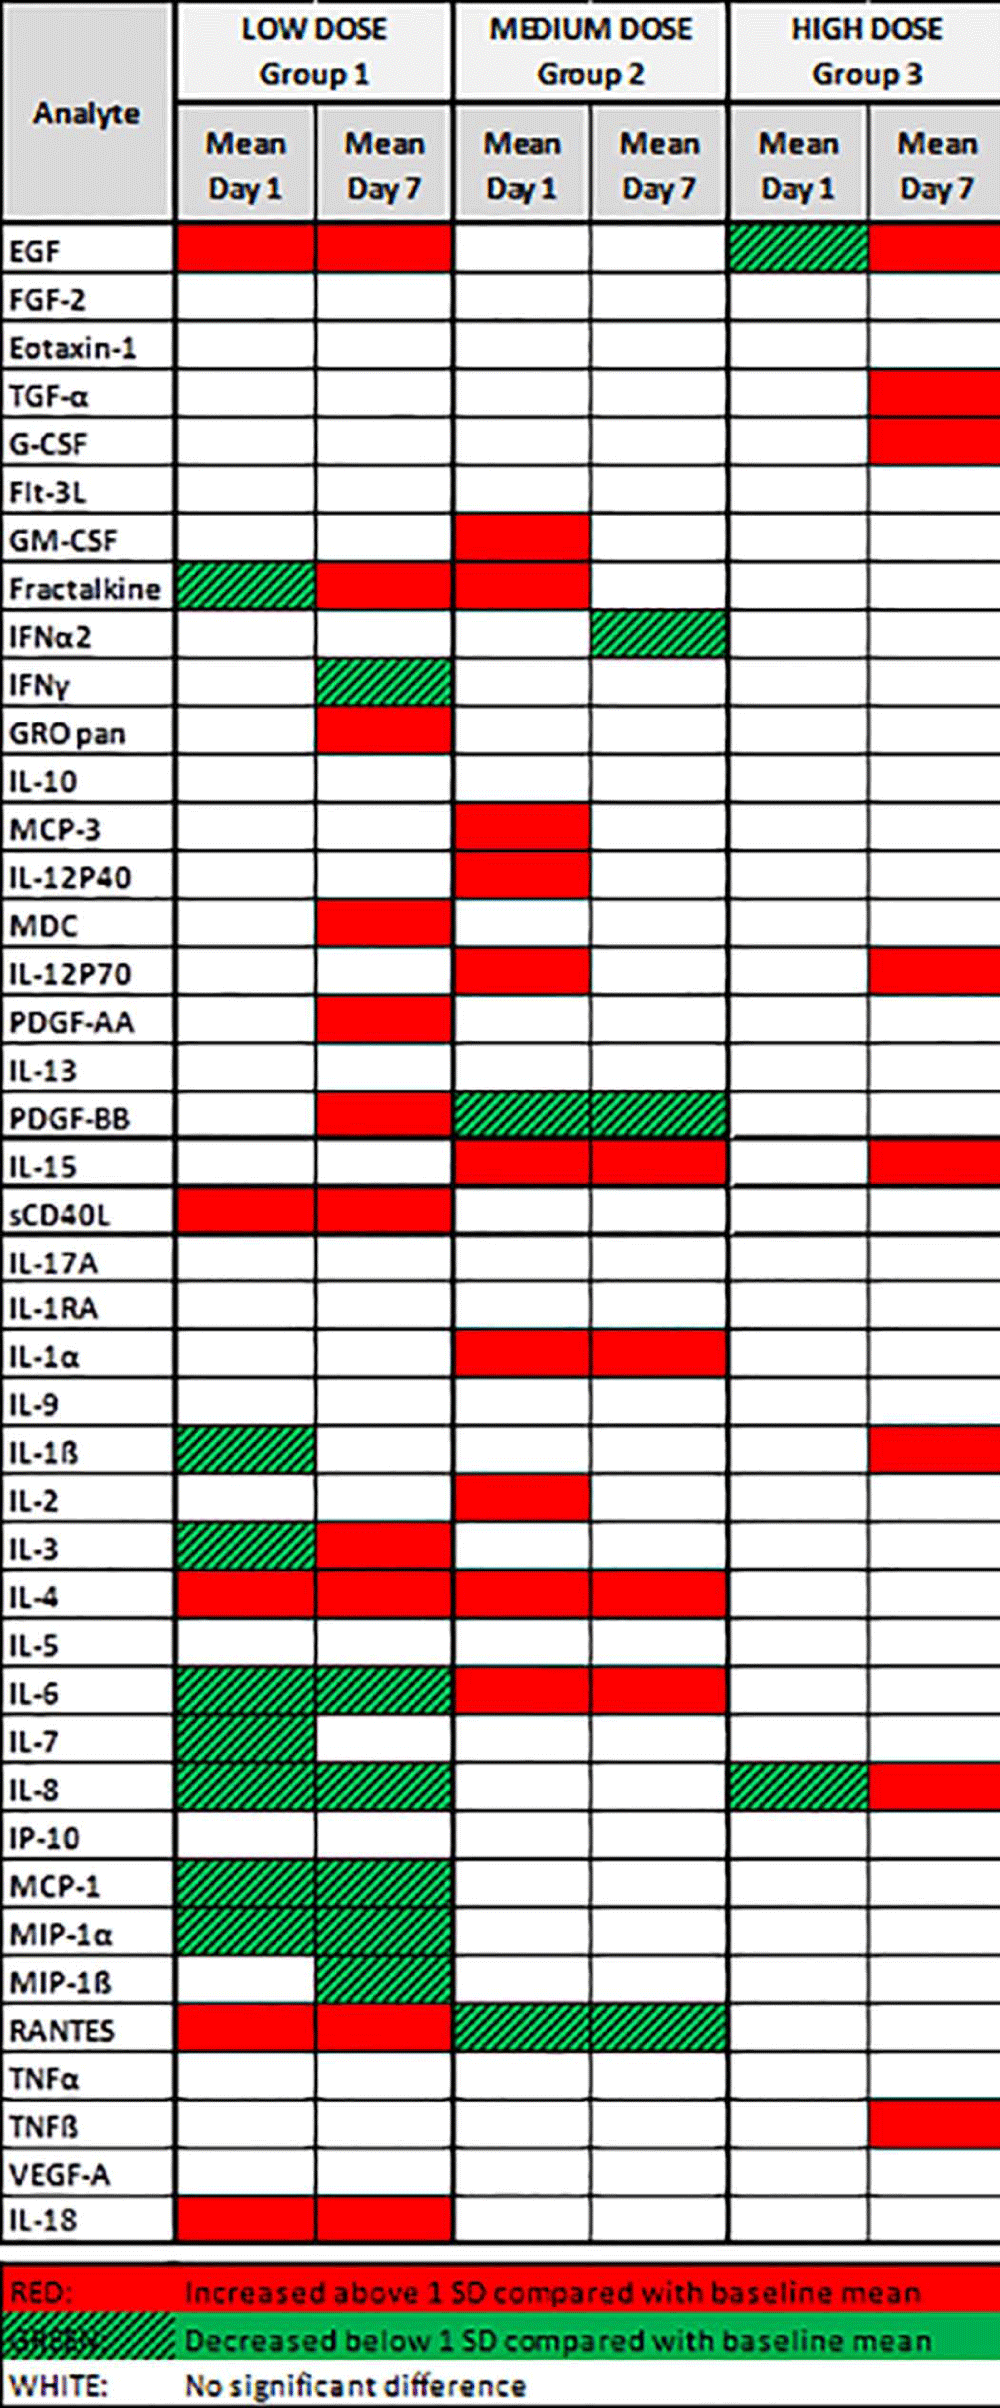
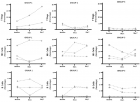
Figure 3:
Cytokines and Growth Factors Profile By MSC Dose Groups. Group 1 received 1×10⁶ MSC/kg; Group 2, received 2×10⁶ MSC/kg; and Group 3, received 4×10⁶ MSC/kg. Plasma was analyzed for the presence and concentration of 42 secreted human cytokines and chemokines. Changes in cytokine levels greater or less than 1 SD from the mean baseline levels were considered significant. Overall, the number of cytokines and growth factors affected appeared to decrease with increasing MSC dose.
EGF- Epidermal Growth Factor; FGF-2- Fibroblast Growth Factor 2; Flt-3L- Fms-Like Tyrosine Kinase 3 Ligand; G-CSF- Granulocyte Colony Stimulating Factor; GM-CSF- Granulocyte Monocyte Colony Stimulating Factor; GRO pan- Growth-Related Onconge; IL- Interleukin; INFα2- Interferon α 2; INFγ- Interferon γ; IP 10- Interferon γ-Induced Protein; MCP- Monocyte Chemoattractant Protein; MIP- Macrophage Inflammatory Protein; PDGF- Platelet-Derived Growth Factor; AA- Two a sub-units; BB- Two b sub-units; RA- Receptor Antagonist; RANTES- Regulated on activation normal T cell expressed and secreted; sCD40L- Soluble Cluster of differentiation 40 ligand; TGFα- Tumor growth factor α; TNFα- Tumor Necrosis Factor α; TNFβ- Tumor Necrosis Factor β; VEGF-A- Vascular Endothelial growth factor A.
Read Full Article HTML DOI: 10.29328/journal.jsctt.1001012 Cite this Article Read Full Article PDF
More Images
Similar Articles
-
The Femoral Head of Patients with Hip Dysplasia is not as Osteogenic as Iliac Crest Bone LocationPhilippe Hernigou*,Yasuhiro Homma,Arnaud Dubory,Jacques Pariat,Damien Potage,Charles Henri Flouzat Lachaniette,Nathalie Chevallier,Helene Rouard . The Femoral Head of Patients with Hip Dysplasia is not as Osteogenic as Iliac Crest Bone Location. . 2017 doi: 10.29328/journal.jsctt.1001001; 1: 001-007
-
Stemness of Mesenchymal Stem CellsTong Ming Liu*. Stemness of Mesenchymal Stem Cells. . 2017 doi: 10.29328/journal.jsctt.1001008; 1: 071-073
-
Preliminary Report on the Effect of Mesenchymal Stem Cell Therapy in Patients with Chronic Lung Allograft DysfunctionCesar A Keller*,Thomas A Gonwa,Athena L Russell,David O Hodge,David B Erasmus,Abba C Zubair. Preliminary Report on the Effect of Mesenchymal Stem Cell Therapy in Patients with Chronic Lung Allograft Dysfunction. . 2018 doi: 10.29328/journal.jsctt.1001012; 2: 035-047
-
Human mesenchymal stem cells conditioned media promotes the wound healing process - An in vitro studyRashi K Jain*,Devashree Vakil,Corey Cunningham,Kuldip Sidhu. Human mesenchymal stem cells conditioned media promotes the wound healing process - An in vitro study. . 2019 doi: 10.29328/journal.jsctt.1001016; 3: 028-030
-
Natural killer cells in patients with hematologic malignancies, solid tumors and in recipients of hematopoietic stem cell transplantationAl-Anazi KA*,Al-Jasser AM,Al-Anazi WK. Natural killer cells in patients with hematologic malignancies, solid tumors and in recipients of hematopoietic stem cell transplantation. . 2019 doi: 10.29328/journal.jsctt.1001017; 3: 031-055
-
The rising role of mesenchymal stem cells in the treatment of COVID-19 infectionsAl-Anazi KA*,Al-Jasser AM. The rising role of mesenchymal stem cells in the treatment of COVID-19 infections. . 2020 doi: 10.29328/journal.jsctt.1001021; 4: 011-016
-
Update on the Use of Mesenchymal Stem Cells and their Products in Hematopoietic Stem Cell TransplantationKhalid Ahmed Al-Anazi*, Ahmed Ayyad and Solaf Kanfer. Update on the Use of Mesenchymal Stem Cells and their Products in Hematopoietic Stem Cell Transplantation. . 2023 doi: 10.29328/journal.jsctt.1001032; 7: 024-033
-
Update on the Use of Mesenchymal Stem Cells in the Treatment of Various Infectious Diseases Including COVID-19 InfectionKhalid A Al-Anazi*, Rehab Y Al-Ansari. Update on the Use of Mesenchymal Stem Cells in the Treatment of Various Infectious Diseases Including COVID-19 Infection. . 2023 doi: 10.29328/journal.jsctt.1001033; 7: 034-042
-
Update on the Clinical Applications of Mesenchymal Stem CellsKhalid Ahmed Al-Anazi*. Update on the Clinical Applications of Mesenchymal Stem Cells. . 2023 doi: 10.29328/journal.jsctt.1001034; 7: 043-064
-
Update on Mesenchymal Stem CellsKhalid Ahmed Al-Anazi*. Update on Mesenchymal Stem Cells. . 2024 doi: 10.29328/journal.jsctt.1001035; 8: 001-003
Recently Viewed
-
Peripheral perfusion index in critically ill COVID-19 and its association with multiorgan dysfunctionCornu Matias German*, Tonelier Matias, Roel Pedro, Sanhueza Laura, Orozco Sergio Martin, Sepulveda Mariana Elizabet, Svampa Silvana Enrica, Arana Osorio Erick and Martinuzzi Andres Luciano Nicolas. Peripheral perfusion index in critically ill COVID-19 and its association with multiorgan dysfunction. J Clin Intensive Care Med. 2023: doi: 10.29328/journal.jcicm.1001043; 8: 004-013
-
Dalbavancin and moleculight in the COVID-19 pandemicWayne J Caputo*, George Fahoury, Donald Beggs, Patricia Monterosa. Dalbavancin and moleculight in the COVID-19 pandemic. J Clin Intensive Care Med. 2023: doi: 10.29328/journal.jcicm.1001042; 8: 001-003
-
Development of Latent Fingerprints Using Food Coloring AgentsKallu Venkatesh,Atul Kumar Dubey,Bhawna Sharma. Development of Latent Fingerprints Using Food Coloring Agents. J Forensic Sci Res. 2024: doi: 10.29328/journal.jfsr.1001070; 8: 104-107
-
Crime Scene Examination of Murder CaseSubhash Chandra*,Pradeep KR,Jitendra P Kait,SK Gupta,Deepa Verma. Crime Scene Examination of Murder Case. J Forensic Sci Res. 2024: doi: 10.29328/journal.jfsr.1001071; 8: 108-110
-
Challenges and Concerns of Parents with Children with Down Syndrome. Challenges and Concerns of Parents with Children with Down Syndrome. Arch Psychiatr Ment Health. 2023: doi: 10.29328/journal.apmh.1001048; 7: 015-017
Most Viewed
-
Evaluation of Biostimulants Based on Recovered Protein Hydrolysates from Animal By-products as Plant Growth EnhancersH Pérez-Aguilar*, M Lacruz-Asaro, F Arán-Ais. Evaluation of Biostimulants Based on Recovered Protein Hydrolysates from Animal By-products as Plant Growth Enhancers. J Plant Sci Phytopathol. 2023 doi: 10.29328/journal.jpsp.1001104; 7: 042-047
-
Sinonasal Myxoma Extending into the Orbit in a 4-Year Old: A Case PresentationJulian A Purrinos*, Ramzi Younis. Sinonasal Myxoma Extending into the Orbit in a 4-Year Old: A Case Presentation. Arch Case Rep. 2024 doi: 10.29328/journal.acr.1001099; 8: 075-077
-
Feasibility study of magnetic sensing for detecting single-neuron action potentialsDenis Tonini,Kai Wu,Renata Saha,Jian-Ping Wang*. Feasibility study of magnetic sensing for detecting single-neuron action potentials. Ann Biomed Sci Eng. 2022 doi: 10.29328/journal.abse.1001018; 6: 019-029
-
Pediatric Dysgerminoma: Unveiling a Rare Ovarian TumorFaten Limaiem*, Khalil Saffar, Ahmed Halouani. Pediatric Dysgerminoma: Unveiling a Rare Ovarian Tumor. Arch Case Rep. 2024 doi: 10.29328/journal.acr.1001087; 8: 010-013
-
Physical activity can change the physiological and psychological circumstances during COVID-19 pandemic: A narrative reviewKhashayar Maroufi*. Physical activity can change the physiological and psychological circumstances during COVID-19 pandemic: A narrative review. J Sports Med Ther. 2021 doi: 10.29328/journal.jsmt.1001051; 6: 001-007

HSPI: We're glad you're here. Please click "create a new Query" if you are a new visitor to our website and need further information from us.
If you are already a member of our network and need to keep track of any developments regarding a question you have already submitted, click "take me to my Query."


