Figure 8
Enhancing adipose stem cell chondrogenesis: A study on the roles of dexamethasone, transforming growth factor β3 and ascorbate supplements and their combination
Bernard J Van Wie*, Arshan Nazempour##, Chrystal R Quisenberry## and Nehal I Abu-Lail
Published: 31 July, 2017 | Volume 1 - Issue 1 | Pages: 028-051
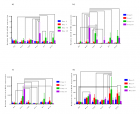
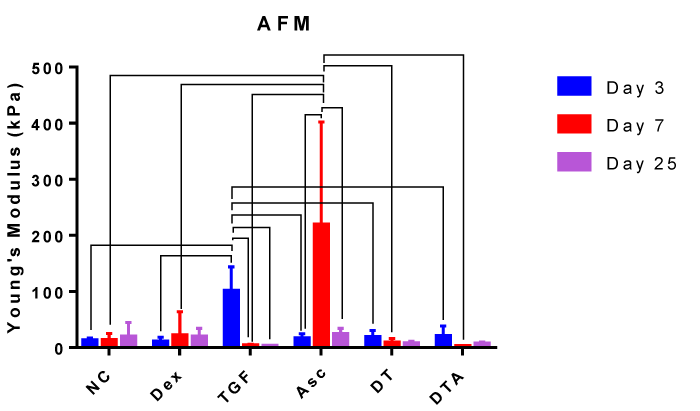 8: Bar graph representing the elastic modulus for each treatment group at day 3, 7 and 25 as indicated. Error bars indicate standard error of mean. Error bars indicate standard deviation and connected treatments are significantly different. The amount of target normalized to housekeeping gene, GAPDH, and hASC values obtained prior to differentiation assays at day 0 were considered as the reference. NC: HG-DMEM/F12 supplemented with 1 mM sodium pyruvate, 2 mM L-glutamine, 5 μg/ml Gentamicin, 1% insulin-transferrin-selenium, 50 μM L-proline, and 1% penicillin-streptomycin; Dex: NC+100nM dexamethasone; TGF: NC+10 ng/ml TGF-β3; Asc: NC+50 μg/ml L-ascorbic acid; DT: NC+100 nM Dex+10 ng/ml TGF-β3; DTA: NC+100 nM Dex+50 μg/ml Asc+10 ng/ml TGF-β3." alt="jsctt-aid1004-g008"class="img-responsive img-rounded " style="cursor:pointer">
Figure 8:
8: Bar graph representing the elastic modulus for each treatment group at day 3, 7 and 25 as indicated. Error bars indicate standard error of mean. Error bars indicate standard deviation and connected treatments are significantly different. The amount of target normalized to housekeeping gene, GAPDH, and hASC values obtained prior to differentiation assays at day 0 were considered as the reference. NC: HG-DMEM/F12 supplemented with 1 mM sodium pyruvate, 2 mM L-glutamine, 5 μg/ml Gentamicin, 1% insulin-transferrin-selenium, 50 μM L-proline, and 1% penicillin-streptomycin; Dex: NC+100nM dexamethasone; TGF: NC+10 ng/ml TGF-β3; Asc: NC+50 μg/ml L-ascorbic acid; DT: NC+100 nM Dex+10 ng/ml TGF-β3; DTA: NC+100 nM Dex+50 μg/ml Asc+10 ng/ml TGF-β3.
Read Full Article HTML DOI: 10.29328/journal.jsctt.1001004 Cite this Article Read Full Article PDF
More Images
Similar Articles
-
Enhancing adipose stem cell chondrogenesis: A study on the roles of dexamethasone, transforming growth factor β3 and ascorbate supplements and their combinationBernard J Van Wie*,Arshan Nazempour##,Chrystal R Quisenberry##,Nehal I Abu-Lail. Enhancing adipose stem cell chondrogenesis: A study on the roles of dexamethasone, transforming growth factor β3 and ascorbate supplements and their combination. . 2017 doi: 10.29328/journal.jsctt.1001004; 1: 028-051
-
A flow perfusion bioreactor with controlled mechanical stimulation: Application in cartilage tissue engineering and beyondBernard J Van Wie*,Arshan Nazempour. A flow perfusion bioreactor with controlled mechanical stimulation: Application in cartilage tissue engineering and beyond. . 2018 doi: 10.29328/journal.jsctt.1001011; 2: 015-034
Recently Viewed
-
Peripheral perfusion index in critically ill COVID-19 and its association with multiorgan dysfunctionCornu Matias German*, Tonelier Matias, Roel Pedro, Sanhueza Laura, Orozco Sergio Martin, Sepulveda Mariana Elizabet, Svampa Silvana Enrica, Arana Osorio Erick and Martinuzzi Andres Luciano Nicolas. Peripheral perfusion index in critically ill COVID-19 and its association with multiorgan dysfunction. J Clin Intensive Care Med. 2023: doi: 10.29328/journal.jcicm.1001043; 8: 004-013
-
Dalbavancin and moleculight in the COVID-19 pandemicWayne J Caputo*, George Fahoury, Donald Beggs, Patricia Monterosa. Dalbavancin and moleculight in the COVID-19 pandemic. J Clin Intensive Care Med. 2023: doi: 10.29328/journal.jcicm.1001042; 8: 001-003
-
Development of Latent Fingerprints Using Food Coloring AgentsKallu Venkatesh,Atul Kumar Dubey,Bhawna Sharma. Development of Latent Fingerprints Using Food Coloring Agents. J Forensic Sci Res. 2024: doi: 10.29328/journal.jfsr.1001070; 8: 104-107
-
Crime Scene Examination of Murder CaseSubhash Chandra*,Pradeep KR,Jitendra P Kait,SK Gupta,Deepa Verma. Crime Scene Examination of Murder Case. J Forensic Sci Res. 2024: doi: 10.29328/journal.jfsr.1001071; 8: 108-110
-
Challenges and Concerns of Parents with Children with Down Syndrome. Challenges and Concerns of Parents with Children with Down Syndrome. Arch Psychiatr Ment Health. 2023: doi: 10.29328/journal.apmh.1001048; 7: 015-017
Most Viewed
-
Evaluation of Biostimulants Based on Recovered Protein Hydrolysates from Animal By-products as Plant Growth EnhancersH Pérez-Aguilar*, M Lacruz-Asaro, F Arán-Ais. Evaluation of Biostimulants Based on Recovered Protein Hydrolysates from Animal By-products as Plant Growth Enhancers. J Plant Sci Phytopathol. 2023 doi: 10.29328/journal.jpsp.1001104; 7: 042-047
-
Sinonasal Myxoma Extending into the Orbit in a 4-Year Old: A Case PresentationJulian A Purrinos*, Ramzi Younis. Sinonasal Myxoma Extending into the Orbit in a 4-Year Old: A Case Presentation. Arch Case Rep. 2024 doi: 10.29328/journal.acr.1001099; 8: 075-077
-
Feasibility study of magnetic sensing for detecting single-neuron action potentialsDenis Tonini,Kai Wu,Renata Saha,Jian-Ping Wang*. Feasibility study of magnetic sensing for detecting single-neuron action potentials. Ann Biomed Sci Eng. 2022 doi: 10.29328/journal.abse.1001018; 6: 019-029
-
Pediatric Dysgerminoma: Unveiling a Rare Ovarian TumorFaten Limaiem*, Khalil Saffar, Ahmed Halouani. Pediatric Dysgerminoma: Unveiling a Rare Ovarian Tumor. Arch Case Rep. 2024 doi: 10.29328/journal.acr.1001087; 8: 010-013
-
Physical activity can change the physiological and psychological circumstances during COVID-19 pandemic: A narrative reviewKhashayar Maroufi*. Physical activity can change the physiological and psychological circumstances during COVID-19 pandemic: A narrative review. J Sports Med Ther. 2021 doi: 10.29328/journal.jsmt.1001051; 6: 001-007

HSPI: We're glad you're here. Please click "create a new Query" if you are a new visitor to our website and need further information from us.
If you are already a member of our network and need to keep track of any developments regarding a question you have already submitted, click "take me to my Query."


